一 下载对应插件的yaml
https://github.com/kubernetes/kubernetes/tree/master/cluster/addons/cluster-monitoring/influxdb
heapster需要的yaml文件为
grafana-service.yaml heapster-controller.yaml heapster-service.yaml influxdb-grafana-controller.yaml influxdb-service.yaml
其中需要更改的就是吧镜像换下,换成自己可以下载的镜像。
下载gcr的镜像参考文档
http://blog.csdn.net/qq_27028561/article/details/79064414
influxdb-service.yaml 更改下面内容,其他的yaml不变。
vim influxdb-service.yaml
spec:
  type: NodePort
  ports:
    - name: http
      port: 8083
      targetPort: 8083
    - name: api
      port: 8086
      targetPort: 8086
      name: admin
  selector:
    k8s-app: influxGrafana
grafana-service.yaml heapster-service.yaml 都改成使用nodeport方式,因为我用apiserver的proxy方式访问,无法访问。
kubectl cluster-info
Kubernetes master is running at https://192.168.76.250:6443
CoreDNS is running at https://192.168.76.250:6443/api/v1/namespaces/kube-system/services/coredns:dns/proxy
Heapster is running at https://192.168.76.250:6443/api/v1/namespaces/kube-system/services/heapster/proxy
Grafana is running at https://192.168.76.250:6443/api/v1/namespaces/kube-system/services/monitoring-grafana/proxy
InfluxDB is running at https://192.168.76.250:6443/api/v1/namespaces/kube-system/services/monitoring-influxdb:http/proxy
验证
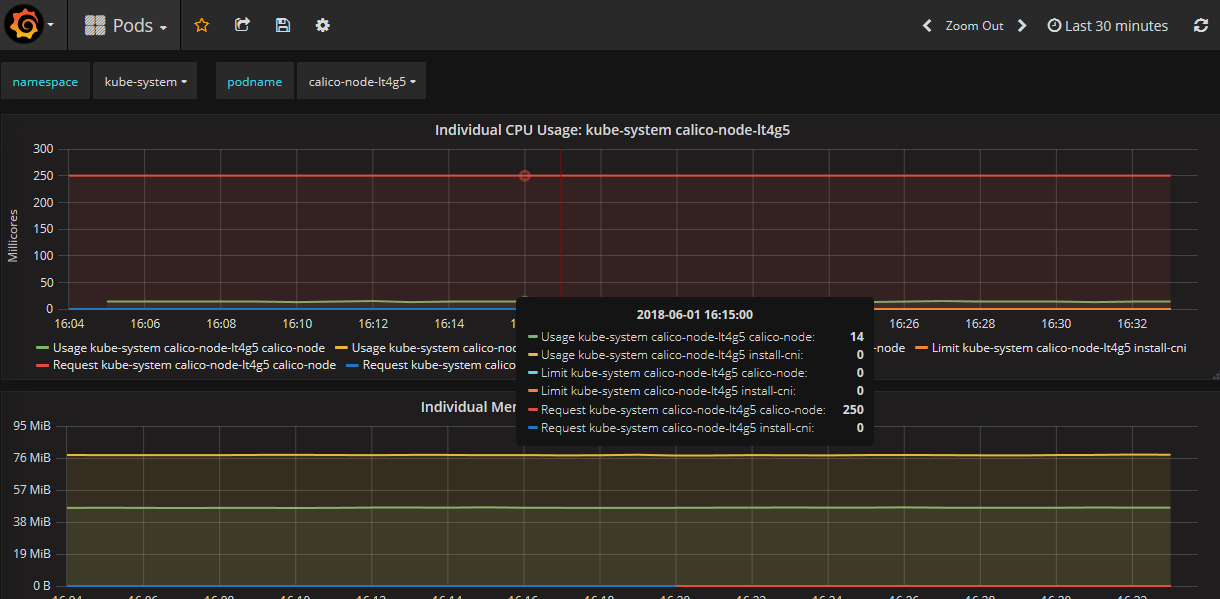
访问grafana看是否有数据
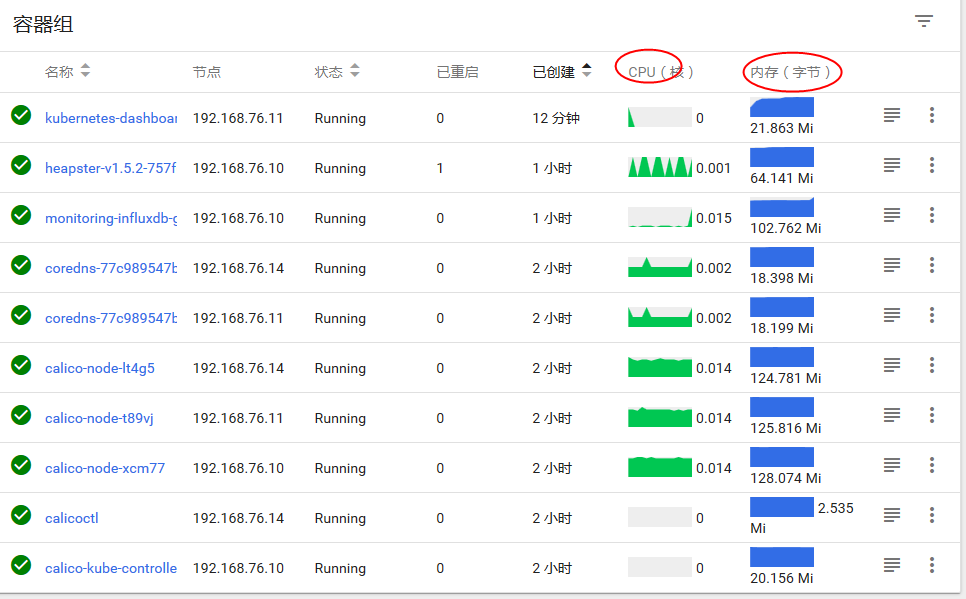
访问dashboard,看容器是否有cpu和内存信息